
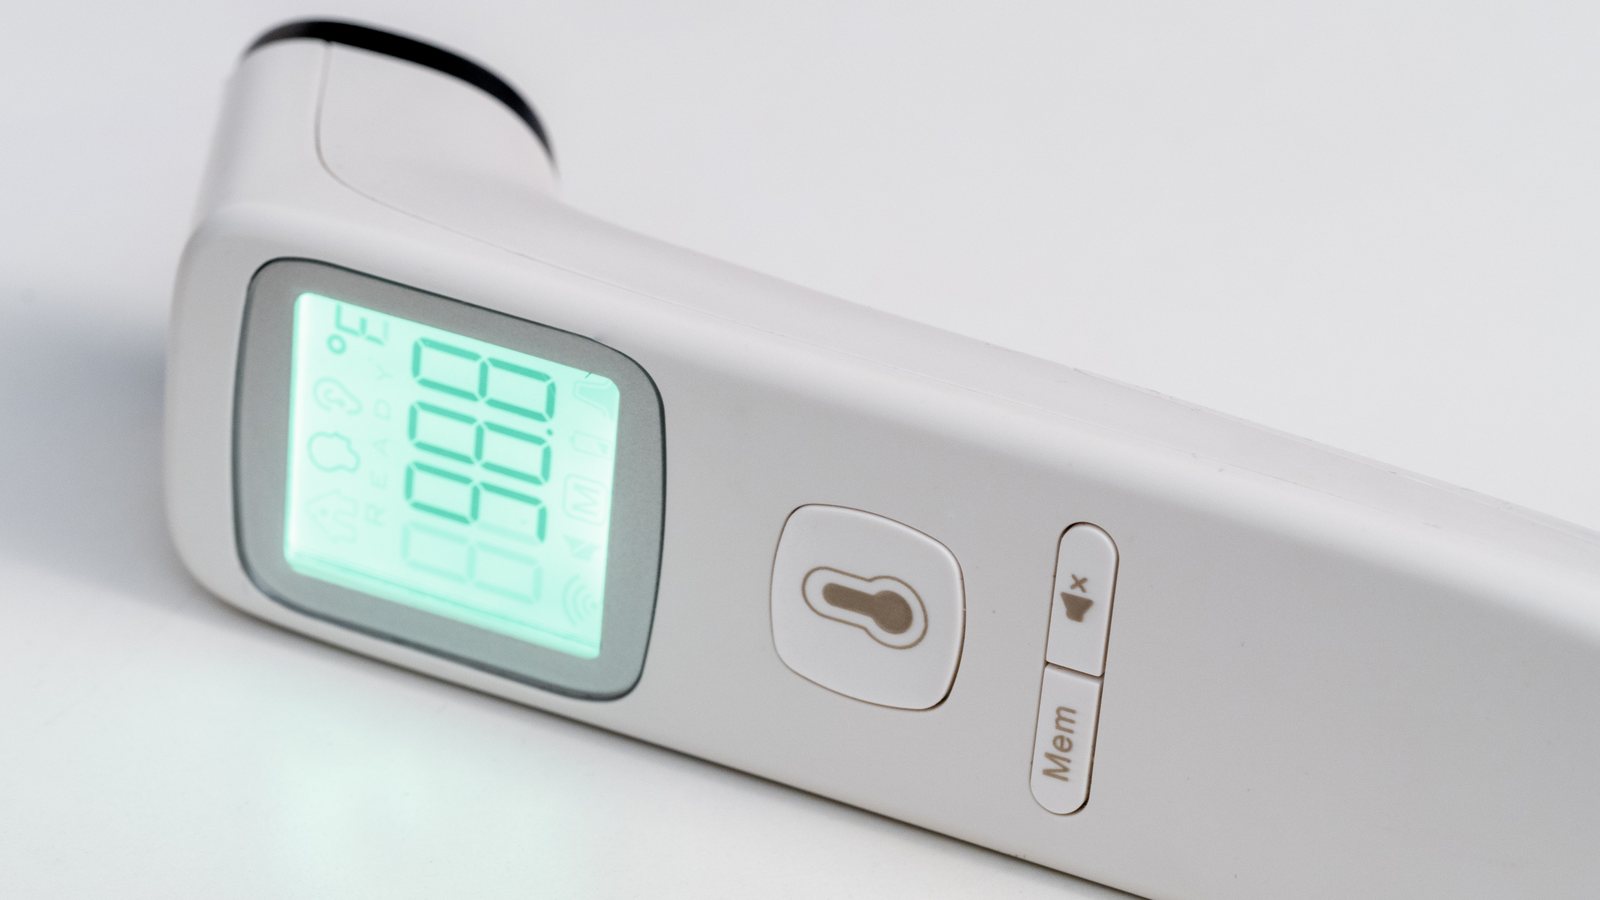

Normal body temperature for a healthy American adult is closer to 97.9°F than 98.6°F, according to Stanford Medicine researchers. Their 2023 study of more than 618,000 readings also found that “normal” varies. It differs from person to person and over the course of a day.
The number most of us learned is a 19th-century average. A separate Stanford study found that US body temperature has fallen by about 0.05°F per decade since then. The leading explanation is that Americans live with less infection and inflammation than their ancestors did.
That matters every time someone reads a thermometer. A reading of 98.6°F is above average for many adults. The gap between your own baseline and a fever may be wider than you think.
Where 98.6 came from
The figure traces to German physician Carl Reinhold August Wunderlich. He took more than a million readings from about 25,000 patients and published the data in 1868, Stanford Medicine says.
Wunderlich himself reported a range. He noted that men and older people ran cooler than women and young adults, and that temperatures rose in the afternoon. But the overall average, 98.6°F, or 37°C, is the number that stuck.
“Instead of thinking about a distribution in temperatures, which is what the initial study showed, we’ve taken a mean of 98.6 F and used it as a cutoff value,” said Catherine Ley, the lead author of the 2023 Stanford study.
Federal health pages still reflect both ideas. MedlinePlus, the National Library of Medicine’s consumer site, says 98.6°F is “generally accepted” as the average.
It adds that some studies put the normal range anywhere from 97°F to 99°F. Temperature also varies by person, age, activity and time of day, the site says.
Three data sets, 157 years, one direction
The case that Americans have cooled comes from a 2020 paper in eLife by Myroslava Protsiv, Julie Parsonnet and colleagues at Stanford. They pooled 677,423 temperature readings from three groups of Americans measured at very different times.
The oldest group is Union Army veterans of the Civil War, examined between 1860 and 1940. The second is the federal National Health and Nutrition Examination Survey of the early 1970s. The third is Stanford patients seen between 2007 and 2017.
The authors adjusted for age, height and weight. Mean body temperature still fell steadily, by 0.03°C (about 0.05°F) for each later birth decade. The decline was nearly identical for men and women.
The obvious objection is that thermometers improved. The authors addressed it by looking inside the Civil War cohort alone, where the same instruments were in use. Temperatures fell there by a similar amount from one birth decade to the next, which, they wrote, “makes measurement error an unlikely explanation.”
A quick check shows how the numbers fit together.
Roughly 15 decades separate Wunderlich’s 1868 report from Stanford’s 2008 to 2017 readings. At 0.05°F per decade, that works out to about 0.75°F.
That is close to the 0.7°F gap between 98.6°F and the 97.9°F average Stanford found. The arithmetic is ours, not the researchers’, and it is only a rough consistency check.
Why bodies may have cooled
The eLife authors offer several explanations, and they rank one first. Chronic inflammation raises body temperature, and Americans today carry far less of it.
The paper points to tuberculosis, malaria and poor dental health in earlier generations. The authors credit better sanitation, living standards and dental hygiene, along with antibiotics, for cutting those burdens.
Metabolism is their second suspect. Body temperature is a rough marker for resting metabolic rate. The authors think that rate has fallen, independent of changes in body size.
The authors also cite wider use of anti-inflammatory drugs such as aspirin and ibuprofen. Heating and air conditioning may play a part too, since bodies spend less energy staying warm in a comfortable home.
None of these has been proved as the cause. The paper calls body temperature “a marker for metabolic rate.” It argues the shift helps explain changes in health and longevity.
The trend is not unique to the US. A 2020 study in Science Advances, led by anthropologist Michael Gurven, tracked the Tsimane, Indigenous forager-farmers in the Bolivian Amazon.
Their average temperature was about 37.0°C in the early 2000s. It fell to about 36.5°C by 2018, based on 17,958 readings from 5,481 adults.
That is a drop of roughly 0.05°C a year. By our arithmetic, it is about 17 times faster than the US rate of 0.03°C per decade.
Infections helped explain why some Tsimane ran warmer than others, but not the decline over time, the authors wrote. They named physical activity, body composition, antibiotic use and the thermal environment as potential causes. The team found no single factor that accounted for the drop, Science News reported.
Your normal is personal, and it moves during the day
The 2023 Stanford study, published in JAMA Internal Medicine, asked a narrower question: what is normal for a healthy adult today? The team analyzed 618,306 oral readings from adult outpatients seen at Stanford Health Care from 2008 to 2017.
To keep illness from skewing the results, they used machine learning to flag diagnoses and medications tied to unusual readings. They then dropped those visits, about a third of the total.
Infectious diseases were linked to high readings. More surprisingly, Type 2 diabetes was linked to low ones.
The remaining data put normal adult temperature between 97.3°F and 98.2°F, with an average of 97.9°F. That is about 36.3°C to 36.8°C, with an average near 36.6°C.
Men ran cooler than women. Temperature fell with age, fell slightly with height and rose with weight. Time of day mattered most: people were coolest in the early morning and warmest around 4 p.m.
“In fact what’s normal depends on the person and the situation, and it’s rarely as high as 98.6 F,” said Parsonnet, the study’s senior author.
Those factors still left a lot unexplained.
Age, sex, height, weight and time of day explained 25% of the variation within a person. They explained 7% of the variation between people.
The researchers said clothing, exercise, the menstrual cycle, the weather and even a hot or cold drink likely play a part. A website built on the study’s model estimates a person’s expected temperature through the day.
What counts as a fever has not changed
Official fever thresholds have stayed put. The Centers for Disease Control and Prevention defines fever as a measured temperature of 100.4°F (38°C) or higher. That definition appears in its guidance for spotting ill travelers.
It also counts feeling warm to the touch or a history of feeling feverish, for example after medicine that could lower the reading. MedlinePlus likewise says a temperature over 100.4°F most often means a fever caused by an infection or illness.
Temperature checks are also part of CDC airport screening, as our report on the Ebola form for passengers flying into the US explains.
Parsonnet says individualized benchmarks could make temperature a more useful vital sign. She told Stanford’s news office about her elderly mother-in-law, who had a serious heart infection. It went undiagnosed for weeks because her temperature never reached a conventional fever.
Stanford notes that fever is usually defined as higher than 100.0°F or 100.4°F. A personal baseline, she suggested, might have flagged the infection sooner.
For now, that is a research idea, not guidance. Nothing in the CDC or MedlinePlus pages tells people to use a lower fever line.
Questions about a specific reading belong with a doctor. Flu season is already under way, and our explainer on the mutated H1N1 strain that started the season early looks at how well this year’s shot matches the virus.
Parsonnet said the next studies could test personalized definitions of fever. They could also ask whether a consistently higher or lower normal temperature affects life expectancy.